News
Vt. is changing how it tracks COVID-19 in the state’s wastewater
Bob Fischer, water quality superintendent for South Burlington, remembers when researchers first realized that they could track the health of a population through its sewer system decades ago.
Measuring all the molecules and organisms that can show up in wastewater requires techniques and tools that started to be developed in the 1980s and 1990s.
Back then, public health officials discussed using it to track drug use at a citywide level. Fischer noticed then that the levels of one substance in particular — caffeine — would go up in the bay whenever University of Vermont students would come back for a semester, and that still happens.
“The fish are probably jonesing when the holiday breaks come,” he said.
More recently, wastewater surveillance has become one of the most promising ways to track diseases like COVID-19 by measuring the prevalence of signs left by the virus in a community’s sewer system.
Experts have said that what we all flush down the drain can offer a more comprehensive picture of what is circulating than individual testing results — most COVID testing today are of the rapid in-home variety that are not regularly reported. Wastewater testing also provides an earlier warning sign than a metric such as the number of people hospitalized with a virus.
However, since the Vermont Department of Health began including wastewater information in its weekly COVID reports in 2022, the tracking effort has been plagued with missing data and confusing or contradictory indicators. For example, figures have sometimes varied wildly from week to week.
State officials hope a new company on the scene can resolve some of the ongoing issues.
Three wastewater systems in Vermont — South Burlington, Essex Junction and Montpelier — are now sending water samples to WastewaterSCAN, a research program run by scientists at Stanford University and Emory University. The program has partnered with Verily, a health technology company owned by Google-parent company Alphabet Inc., which recently won a contract to support the U.S. Centers for Disease Control and Prevention’s national wastewater surveillance system.
Lynn Blevins, an epidemiologist for the state health department, is hopeful that the new data and a new way of displaying that data provided by the new contractor will provide a clearer view of how COVID is spreading in Vermont.
“We felt like people would be more informed by this graph than the prior table, especially going into respiratory season (and) going into holiday seasons,” she said.
The weeks after Thanksgiving, Christmas and New Year’s historically have been the toughest time for COVID in Vermont. The disease hit its peak in January 2022, when the first Omicron strain spread rapidly and strained hospitals and health care providers.
The health department reported on Nov. 29 that COVID levels remain “low,” based on their criteria of hospital admissions for the disease. The department said that 47 people had been newly admitted to hospitals for COVID in the past week, up from 36 the week before.
That’s far from the peak of more than 20 admissions each day during the Omicron wave. Blevins characterized COVID in Vermont as “pretty good” for winter. But she added “it’s not summer, either,” when the state reported only a handful of hospitalizations each day.
Like hospitalizations, data from WastewaterSCAN also indicates that COVID levels are slowly rising, particularly at the South Burlington and Montpelier testing sites. South Burlington also has reported a spike in influenza, even as the health department reports “minimal” disease activity so far this flu season.
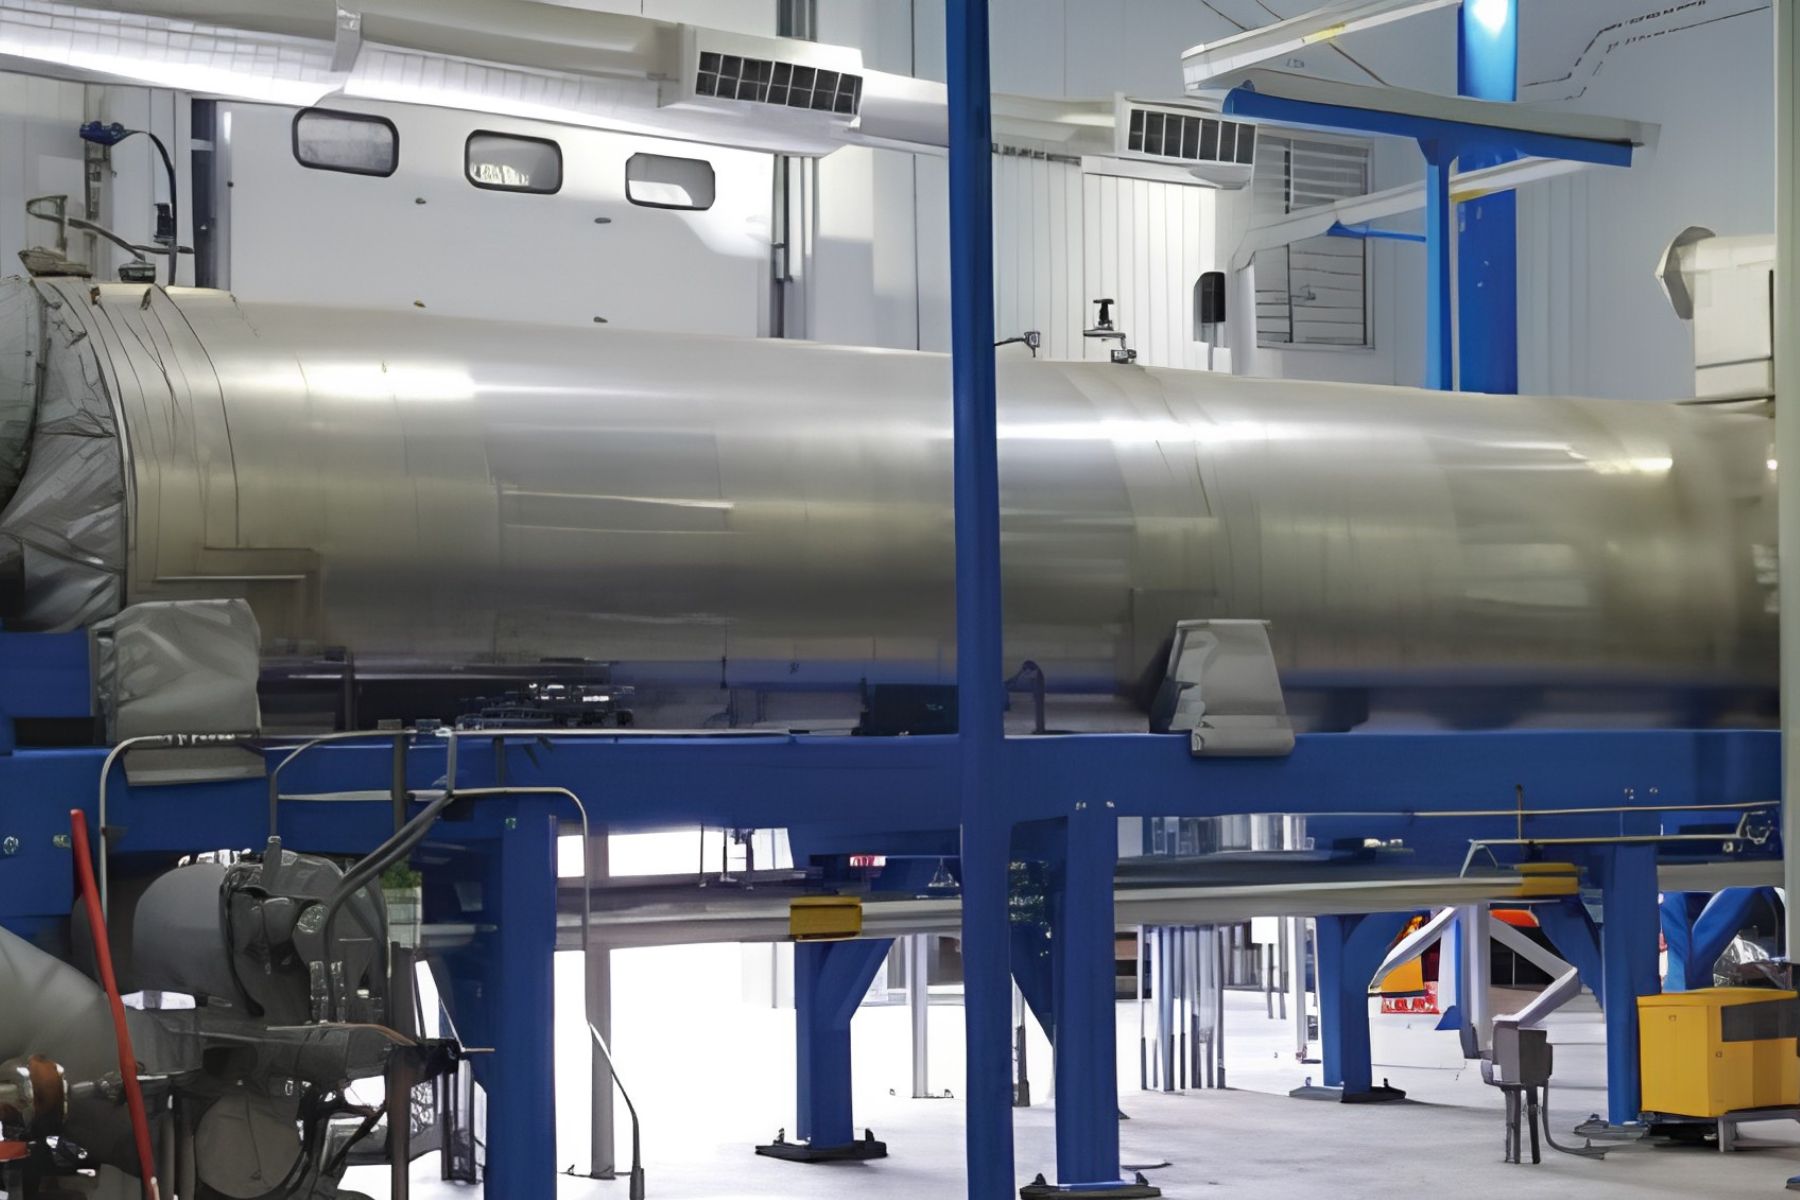
WASTEWATER COVID TEST
Testing wastewater for COVID in Vermont started in August 2020, when the city of Burlington began looking for the virus at its three treatment plants. The city detected the early presence of COVID variants, such as B.1.1.7 and Delta in 2021.
Gradually, the CDC stepped in to expand wastewater testing and publish more testing results from the entire nation in a single place. That led to the National Wastewater Surveillance System, which was the original source of the Vermont Health Department’s wastewater data.
The state health department much prefers the graphic format used by WastewaterSCAN, Blevins said. Distilling data from the CDC and its previous vendor, Biobot Analytics, into an easy-to-digest chart or table has been a challenge. The way that the federal agency first reported it — as an increase or decrease by a certain percent — could be misleading, she said.
“It would say like a 100% increase one week, and then a 100% decrease the next week. Which if you’re just kind of looking a week at a time that looks kind of dramatic, when it really was kind of just a blip, and things are sort of the same,” she said.
Earlier this year, the CDC switched to characterizing the test results as an “increase,” “decrease,” or a “plateau,” but that could still be confusing without the context of how it compares with other time periods, Blevins said.
Part of the difficulty comes from how variable wastewater results can be from week to week. Fischer said it’s best to look at the overall trends rather than the specific number.
“You can’t say there’s 25,000 parts, there’s 50,000 parts, but you can certainly see trends. You can certainly see it going up and going down,” he said. (The wastewater results are reported as parts per million, or ppm.)
With all that in mind, the health department has started simply reporting WastewaterSCAN data for the three sites where it’s available, Blevins said.
That’s a drop from the 11 or so sites that have at times reported wastewater data to the CDC. But Blevins said WastewaterSCAN appeared to be focused so far only on cities with a population of 10,000 or more.
“There is this bias towards larger sewer sheds,” she said. She added that smaller, more rural sites often don’t have enough staffing to be able to do sample collection. (Data from the other locations appear to still be available at the Biobot Analytics website.)
Fischer said Verily offered South Burlington about $15,000 a year for the sample collection, although he was not clear on whether all the Vermont sites were getting paid. South Burlington is still sending data to Biobot but plans to stop doing it when it stops being free.
“Why should we spend money when Verily’s actually paying us to send out the same thing?” he said.
WastwaterSCAN reports extensive details on its methodology on its website, Blevins said. The program also publishes data on more types of diseases, which the health department is still looking into how to use.
The department now has experience with COVID wastewater surveillance and is keeping an eye on viruses like the flu and RSV. What WastewaterSCAN does not track, at this point, is drugs such as opioids or cocaine, which were the original inspiration for wastewater surveillance. Fischer said that idea never really took off, in part because of privacy and civil rights concerns.
But he’s excited for the direction that this technology has taken.
“We’ve been doing it for close to three years now, and you can see it has endless possibilities,” he said.
More News
News
Lightshift eyeing new Vergennes locations for its huge battery
The energy storage company is exploring new sites in the city for a 4.99 megawatt battery … (read more)
Crime News
Local man cited after Rt. 7 stabbing
Middlebury police cited Joshua Puma for 1st degree aggravated domestic assault after he al … (read more)
Homepage Featured News
Energy panel hopes to electrify sewer plant
“This project would add 500 metric tons of greenhouse gas… It is effectively a decision to … (read more)